What Is the Altcoin Season Index and How to Use It
Redakcja CryptoPulsar AI ·
The altcoin season index measures whether most top altcoins are outperforming Bitcoin over a 90-day period. This guide explains how to read it and combine it with CryptoPulsar AI data for broader market context.
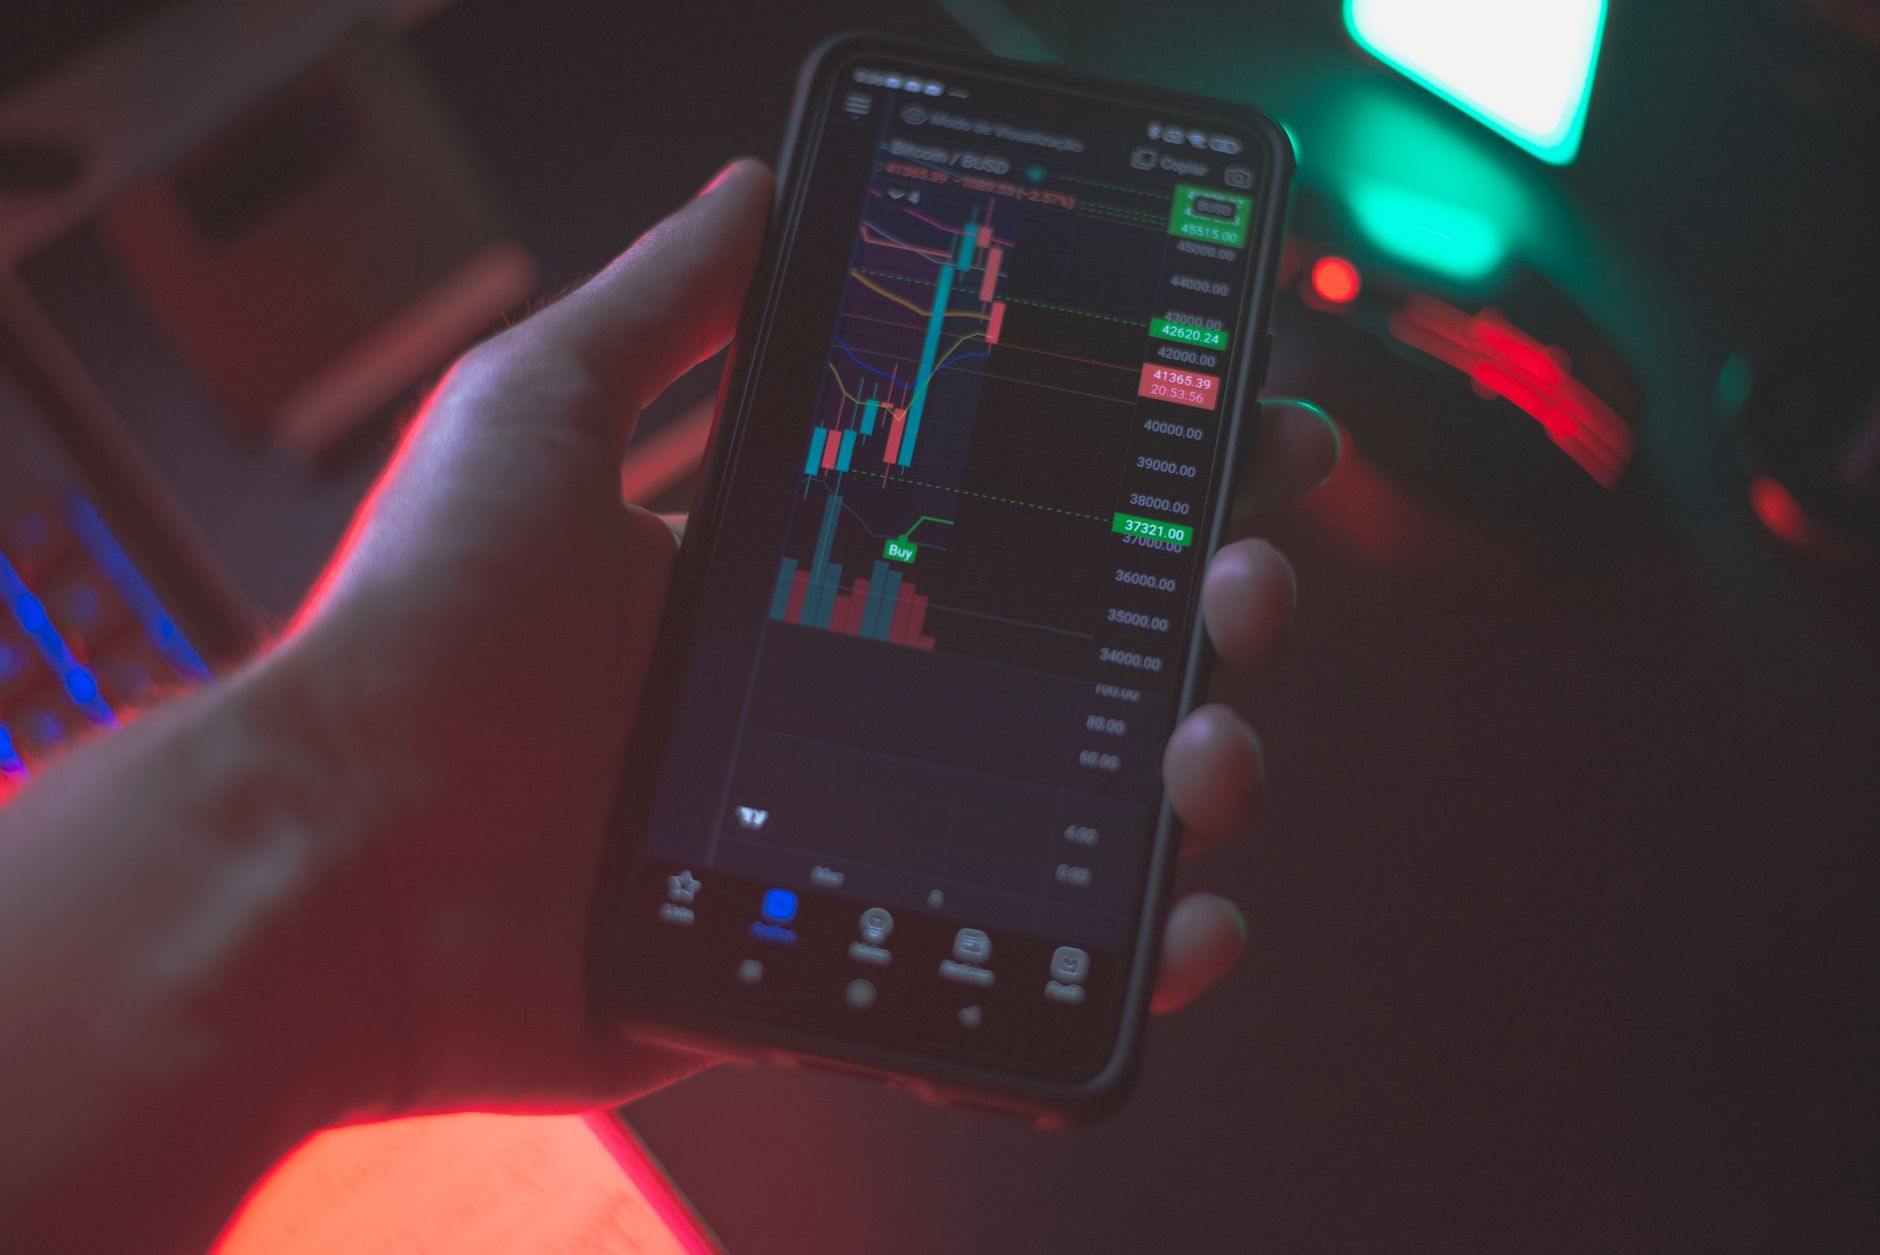
The altcoin season index is a market breadth tool that tracks how many top altcoins are outperforming Bitcoin over a rolling 90-day period. If you typed this phrase because you want to know whether an altcoin rally is broad or just a few coins moving, the index helps you separate Bitcoin-led markets from altcoin-led markets. In this guide, we explain how the index works, how to read its levels, and how to combine it with CryptoPulsar AI tools for live market context.
Key takeaway: Altcoin season is a market structure condition. It is not a buy signal. Use it as one input among many, and always check live data, volume, and cycle context before making a decision.
How the Altcoin Season Index Works
The most widely used version of the altcoin season index compares the 90-day performance of the top 50 altcoins against Bitcoin. If at least 75% of those altcoins have gained more than Bitcoin during that period, the index reads above 75 and the market is considered to be in altcoin season. If 25% or fewer are outperforming Bitcoin, the index reads below 25 and the market is in Bitcoin season. Between 25 and 75 is neutral, often described as a mixed or transitional market.
These ranges follow the commonly used Blockchaincenter methodology. The index is updated regularly, but it is a lagging measurement. It tells you what has already happened over the last three months, not what will happen next. That distinction is important. Altcoin season can be confirmed late, and it can end quickly.
| Index level | Market condition | What it usually means |
|---|---|---|
| 0 to 25 | Bitcoin season | Bitcoin dominates, altcoins lag, risk appetite is lower |
| 25 to 75 | Neutral | Mixed rotation, selected altcoins can work but trend is not broad |
| 75 to 100 | Altcoin season | Most top altcoins are outperforming Bitcoin, risk appetite is high |
For example, if 40 of the top 50 altcoins are beating Bitcoin over 90 days, the index would be 80. That is a broad altcoin season. If only 10 are beating Bitcoin, the index would be 20. That is a Bitcoin-led market where most altcoins are lagging. The absolute price of Bitcoin does not matter here. The comparison is relative.
Why the Altcoin Season Index Matters
Bitcoin drives most crypto cycles, but altcoin season is when capital spreads into the wider market. The index matters because it measures breadth. A rally in two or three large caps is very different from a market where 40 of the top 50 altcoins are beating Bitcoin. Breadth helps you understand whether money is rotating across the ecosystem or whether a single narrative is isolated.
For traders, the index is useful for context, not timing. It can stay high for weeks or turn down quickly. It also does not tell you which altcoin to buy. That is why the index should be paired with live market data and coin-level analysis. You want to know whether the altcoin rally is supported by volume, sector participation, and derivatives activity.
Altcoin season is a map of relative performance. It is not a strategy. It works best when combined with other tools that show real-time market conditions.
How to Use CryptoPulsar AI With the Altcoin Season Index
You can track the altcoin season index outside CryptoPulsar AI, but the platform gives you the surrounding data that makes the index more useful. Start with the dashboard to see live prices, market sentiment, and movement across the crypto market. When the index moves above 75, ask whether the rally is broad enough to trust. The market heatmap shows you quickly which sectors and coins are leading or lagging. A strong altcoin season usually paints most of the heatmap green, while a weak one looks mixed.
Next, use the projects table to compare altcoins by price, market cap, and AI analysis. Do not assume every altcoin is strong just because the index is high. Some coins may be up on low volume or a single news event. The AI analysis helps you see which projects have stronger fundamentals and steadier momentum. Then check CryptoCycle to understand the broader cycle phase. Altcoin season inside a risk-on macro phase is different from altcoin season inside a late-cycle melt-up, so combining the two gives you better context.
A Practical Workflow
Use the following sequence when the altcoin season index starts moving:
- Check the index level. Note whether it is below 25, between 25 and 75, or above 75.
- Open the CryptoPulsar AI dashboard and heatmap. Look for breadth: are many altcoins green or only a few?
- Filter projects by AI score, volume, and market cap. Look for strong coins, not just the most hyped ones.
- Check CryptoCycle. Ask whether the macro cycle supports risk-on altcoin exposure.
- Set alerts for levels you care about. That way you do not have to watch charts all day.
Pro tip: Relative strength can be misleading. An altcoin can outperform Bitcoin while still falling in dollar terms. Check the dollar-denominated price action before deciding that market conditions are healthy.
Altcoin Season Index vs Bitcoin Dominance
People often confuse the altcoin season index with Bitcoin dominance. They are related but not identical. Bitcoin dominance measures Bitcoin's share of total crypto market cap. A falling Bitcoin dominance can happen because Ethereum, stablecoins, or a few large altcoins are growing, not necessarily because a broad altcoin season is underway. The altcoin season index specifically counts how many top 50 altcoins are beating Bitcoin over 90 days.
That means you can have a falling Bitcoin dominance while the altcoin season index is still neutral. In that case, capital may be concentrating in a few names instead of spreading across the market. The index helps you see the difference. When both signals align, Bitcoin dominance is falling and the index is above 75, the altcoin rotation is usually more convincing.
Common Mistakes When Reading the Altcoin Season Index
- Treating it as a buy signal: The index can stay high while prices correct. It measures relative performance, not absolute safety.
- Ignoring Bitcoin moves: Altcoins can outperform a falling Bitcoin but still lose value in dollar terms. Relative outperformance is not the same as making money.
- Chasing late-stage strength: By the time the index reads 90, many altcoins may already be extended. The index is a map, not a green light.
- Forgetting liquidity: Smaller altcoins can look great on relative strength but have thin order books. Check volume and derivatives before trading.
- Overlooking sector concentration: A high index can be driven by one sector like AI tokens or layer 1s. Use the heatmap to see if the rally is broad or narrow.
What to Watch Next
After you understand the altcoin season index, the next step is to build a repeatable process. Use your dashboard to monitor breadth, watch the heatmap for sector rotation, and keep an eye on CryptoCycle for the larger market phase. Over time, you will start to see patterns in how altcoin seasons begin, mature, and cool down. No indicator works in isolation, but the altcoin season index is a useful starting point for understanding when the market is rewarding risk outside Bitcoin.
Want to track altcoin rotation with live data? Open the CryptoPulsar AI dashboard and compare it with the market heatmap to see today's market breadth.
Frequently Asked Questions About the Altcoin Season Index
What is the altcoin season index?
It is a market breadth indicator that compares the 90-day performance of the top 50 altcoins against Bitcoin. If at least 75% are outperforming Bitcoin, the market is usually considered to be in altcoin season.
What index level means altcoin season?
A value above 75 typically signals altcoin season. A value below 25 signals Bitcoin season. Between 25 and 75 is neutral, meaning the market is mixed.
Does altcoin season guarantee profits?
No. Altcoin season only shows relative performance against Bitcoin. Prices can still fall, and timing matters. It is not a trading recommendation.
How can I use CryptoPulsar AI to track altcoin season?
You can combine the index with the CryptoPulsar AI dashboard, heatmap, projects table, and CryptoCycle to see whether the rally is broad, liquid, and aligned with the market cycle.
Is altcoin season the same as falling Bitcoin dominance?
They are related but not identical. Falling Bitcoin dominance can happen when Ethereum or stablecoins grow, while the altcoin season index specifically tracks outperformance of top altcoins against Bitcoin over 90 days.
This article is for educational purposes only and does not constitute financial, investment, or trading advice. Always do your own research before making any crypto decision.